Indicator guide

How to read
ES1Levels

Bulls hunting FBDs. We never chase. We sit on our hands and wait for the flush, then the recovery.
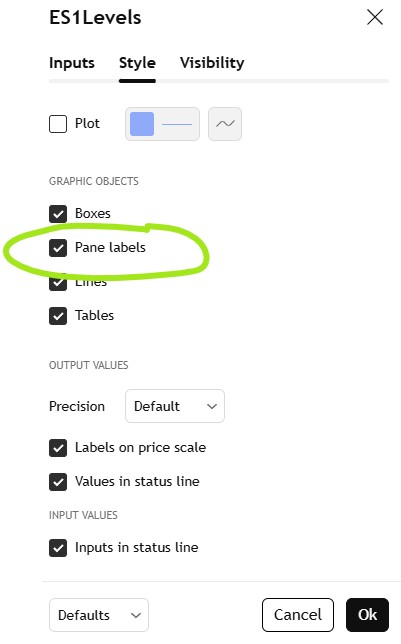
Pane labels

The most important feature. Every major level carries the exact action from the newsletter โ€” hover it and the full plan appears. Make sure this is enabled in the Style tab.

๐Ÿท๏ธ Style tab โ†’ Pane labels must be checked Most important

If labels are not showing on your chart, this is the first thing to check. One tick and every level becomes a full briefing note.
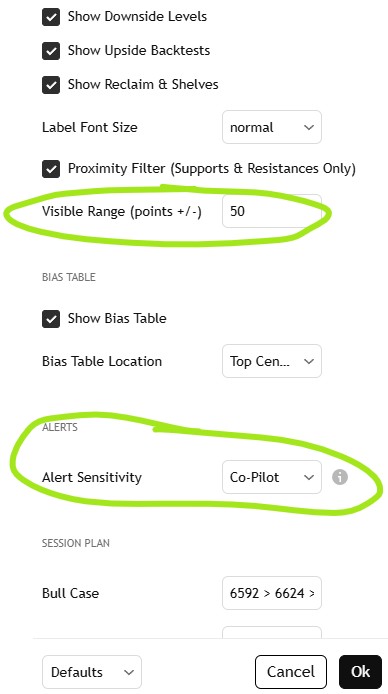
Pane labels setting in TradingView Style tab

Visible range

Controls how many levels appear around current price. Adjust it to match your session โ€” tighter for focus, wider for planning ahead.

๐Ÿ”ญ Inputs tab โ†’ Visible Range (points ยฑ) Adjust to taste

Default is 80 points. The key overlay lines โ€” yellow pivot, green reclaim, lime shelf, amber trigger, purple best entry โ€” are always visible regardless of this setting.

Visible range setting in TradingView Inputs tab

The bias table โ€” top of chart

Two rows. Fixed for the entire session. This is the newsletter plan at a glance โ€” it does not react to price. Move it or hide it in the settings if it gets in the way.

BULL CASE
The bull path chain from the morning newsletter. Set once before the session opens โ€” holds the targets in order for as long as levels hold.
BEAR CASE
The downside scenario trigger levels from the newsletter โ€” what to watch and in what order if the bull case breaks. A reminder, not a live signal.

The bottom banner โ€” your action engine

This is the live signal. Four states, one clear instruction each time it changes. Set one TradingView alert โ€” "Any Alert() function call" โ€” and it notifies you every time the banner changes state.

๐ŸŸข BULL
FBD entries are valid. Follow the bull path chain. This is where we want to be โ€” hunting longs at key levels.
๐ŸŸ  HANDS OFF
Shelf has broken. Sit on your hands. The FBD setup is developing โ€” do not chase. The banner shows the exact level to watch for the next entry.
๐ŸŸ  ACCEPTANCE
Key moment โ€” market is finding its footing. Watch the shelf reaction. Hold above = FBD long developing. Fail = next level down. This is the trigger to start paying close attention.
๐Ÿ”ด ELEVATOR DOWN
Flush in progress. Do absolutely nothing. No knife catching. The banner shows the next FBD objectives below โ€” wait for the flush to complete before considering any entry.

The golden rules

These apply every session, regardless of what the levels say.

1
We are bulls. Always. We hunt FBDs โ€” we do not fight the market. We sit on our hands and wait for the setup to come to us.
2
Never buy into a fast-falling market. Wait for the flush to complete, wait for a recovery, then enter.
3
A major support does not mean price stops there. It means there is a potential FBD setup if price flushes below and recovers back above.
4
Hover the pane label. Every major level has the full action plan attached โ€” what to do, what not to do, and what to watch next if it fails.
5
Zero alerts on a quiet day is a good day. No trade is also a trade. Only act when price gives you a proper FBD setup.
6
Read the evening newsletter before the session. The indicator plots the levels โ€” the newsletter gives you the context and the reasoning behind each one.

Color reference

Every line color has one job. Quick reference only โ€” the pane labels carry the full detail.

Yellow โ€” Bull / Bear Pivot
Range boundary. Above = bulls in control.
Green โ€” Reclaim Level
Key shelf. Reclaim = actionable FBD entry.
Lime box โ€” FBD Shelf
Flush both lows then recover = long entry.
Amber dashed โ€” Trigger & Sweep Lows
Elevator down trigger + prior session wick lows.
Purple โ€” Best Entry
Highest R/R FBD in the plan. Read the label.
Blue solid โ€” Major Supports
Named levels. Always read the pane label for action.
Blue dashed โ€” Minor Supports
Speed bumps. Not actionable on their own.
Red solid โ€” Major Resistances
Bull targets and named upside levels.
Red dashed โ€” Minor Resistances
Upside reference only. Not actionable.

Legal disclaimer
ES1Levels is an independent TradingView indicator that maps out levels published in Adam Mancini's newsletter. It is not affiliated with Adam Mancini or any of his products. Nothing on this chart or this page constitutes financial advice or an instruction to trade. All levels, signals, and engine states are for informational purposes only. Trading futures involves a significant risk of loss and is not suitable for all investors. Every user is solely responsible for their own trading decisions and any resulting gains or losses. Past performance is not indicative of future results.